
Beer mapping with python (Part 2)
Hi Guys! here I am again, this second post is the following part of the Beer mapping part 1, where we played arround with points, colors and clusters. This time we will be looking on how to work with polygons and areas with python and how to interact points with the polygons objects.
Datasets
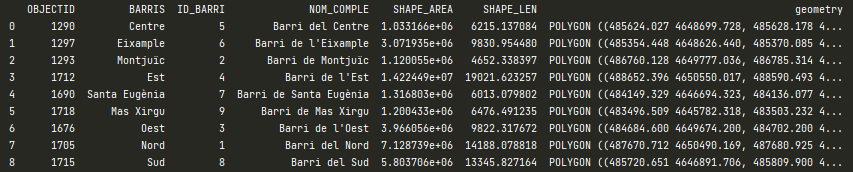
We will continue the work with the same activities file used in part 1, but a shapefile will be included for neighbourhood geometry data, the used file is a .shp provided by GOD (Girona Open Data). This new dataset has the following structure:
Display neighbourhood shapes
So, lets put hands to work. Down here there is the main component.
import folium
import pandas as pd
import geopandas as gpd
import helpers
from branca.colormap import linear

input_activities = "./raw_data/activitats/activitats2020_bars.csv"
input_neighbourhoods = "./raw_data/barris/Barris.shp"
center = [41.97969558739158, 2.8213967358161915]

act_df = gpd.read_file(input_activities)
nbh_df = gpd.read_file(input_neighbourhoods)

# Insert and Transform coordinates projection
bars_df = helpers.coordinates_to_point_activities(act_df)

# Transform geometries to a new coordinate reference system.
nbh_df = nbh_df.to_crs(epsg=4236)

# Insert random prices to bars
bars_df_with_price = helpers.add_random_price_to_df(act_df)

# Locate points inside polygon and insert into bars df
nbh_bars_dict = helpers.get_neighborhoods_location(nbh_df, bars_df_with_price)
bars_df_with_nbh = helpers.insert_neighbourhood_into_df(bars_df_with_price, nbh_bars_dict)

# Group bars into neighbourhoods
nbh_count_df = bars_df_with_nbh.groupby('NOM_COMPLE')['id'].nunique().reset_index()
nbh_count_df.rename(columns={'id':'nb'}, inplace=True)
nbh_geo_count_df = pd.merge(nbh_df, nbh_count_df, on='NOM_COMPLE')

# Calculate quote part for each neighbourhood
nbh_geo_count_df['quote_part'] = nbh_geo_count_df['nb'] / nbh_geo_count_df['nb'].sum()
nbh_geo_count_df['quote_part_pct'] = nbh_geo_count_df['quote_part'].apply(lambda x : str(round(x*100, 1)) + '%')
print(nbh_geo_count_df)

# Create a map
map_girona = folium.Map(location=center, zoom_start=13, tiles='Stamen Toner')
nbh_count_colormap = linear.YlGnBu_09.scale(min(nbh_count_df['nb']), max(nbh_count_df['nb']))
style_function = lambda x: {
    'fillColor': nbh_count_colormap(x['properties']['nb']),
    'color': 'black',
    'weight': 1.5,
    'fillOpacity': 0.7
}
folium.GeoJson(
    nbh_geo_count_df,
    style_function=style_function,
    tooltip=folium.GeoJsonTooltip(
        fields=['NOM_COMPLE', 'nb', 'quote_part_pct'],
        aliases=['Neighbourhood', 'Location amount', 'Amount %'],
        localize=True
    )
).add_to(map_girona)
nbh_count_colormap.caption = 'Girona bars location amount'
nbh_count_colormap.add_to(map_girona)
map_girona.save('index.html')
As you see, to align crs for bars and nbh dataframes, we had to transform it with to_crs method from geodataframe object, it allows us to transform geometries to a new coordinate reference system, in this case 4236.
The next step is to locate bar points within the neighbourhood area and include them into bars df, for that I have created the methods get_neighborhoods_location and insert_neighbourhood_into_df, let get a look to the first one.
With get_neighborhoods_location, we iterate for each nbh and look if the bar is inside the polygon area, to do that we use the .within method that belongs to the Polygon object and checks if a point is within a polygon. In our case, if belongs, we add it to a dictionary where bar name is the key and nbh the value.
def get_neighborhoods_location(nbh_df, bars):

    nbh_bar_dict = {}

    for _, nbh in nbh_df.iterrows():
        locate_points_inside_polygon(nbh,bars,nbh_bar_dict)

    return nbh_bar_dict

def locate_points_inside_polygon(nbh, bars, nbh_bar_dict):
    bars_in_nbh_dict_to_add = {}
    polygon = nbh['geometry']

    for _,bar in bars.iterrows():
        if (bar['geometry'].within(polygon)):
            bars_in_nbh_dict_to_add[bar['Nom_comercial']] = nbh['NOM_COMPLE']

    nbh_bar_dict.update(bars_in_nbh_dict_to_add)
Then with insert_neighbourhood_into_df we only insert the values to the bars_df.
def insert_neighbourhood_into_df(bars_df, nbh_bars_dict):
    neighbourhood_colum_values = []
    uids = []

    for _, bar in bars_df.iterrows():
        nbh_value = nbh_bars_dict.get(bar['Nom_comercial'])
        neighbourhood_colum_values.append(nbh_value)
        uids.append(uuid.uuid1())

    bars_df['NOM_COMPLE'] = neighbourhood_colum_values
    bars_df['id'] = uids
    return bars_df
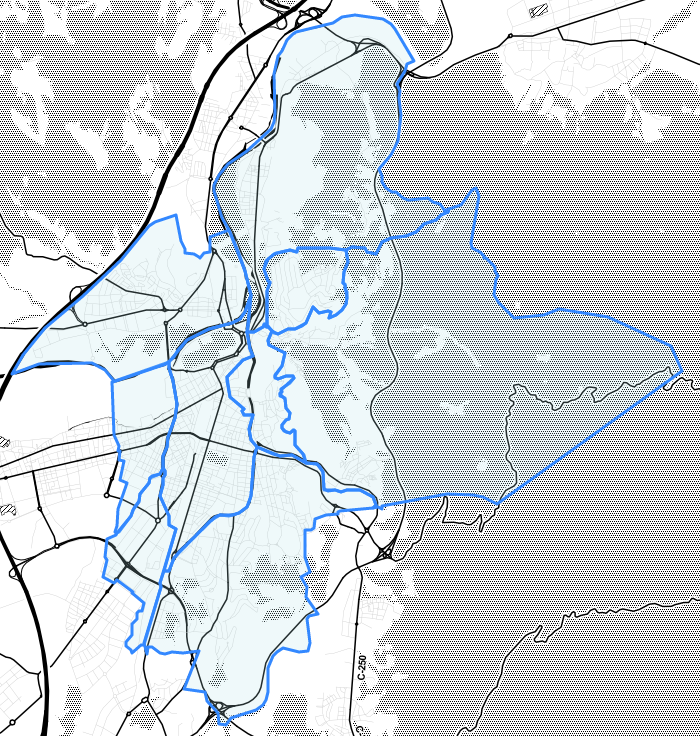
So until here if we dont apply any styling to our map with style_function it would look something like:
Display neighbourhoods with the amount of bars
Let put some style on the map then! Next step is to group bars into hoods so we can have the total amount of bars per hood and do our calculations. In order to do that we group by nbh name with groupby df method which will give a df with the amount of bars per nbh and save it into new df that will be merged with the nbh_df.
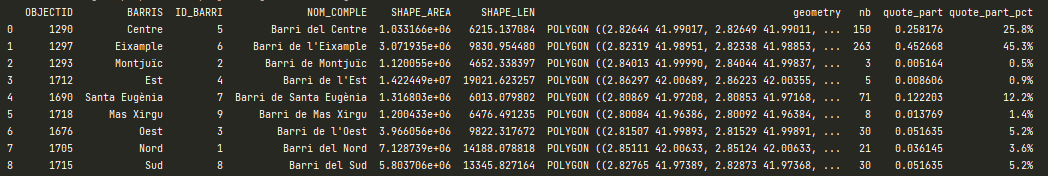
Then the quote part is calculated and added into the nbh_geo_count_df for each nbh, and after that our df should be:
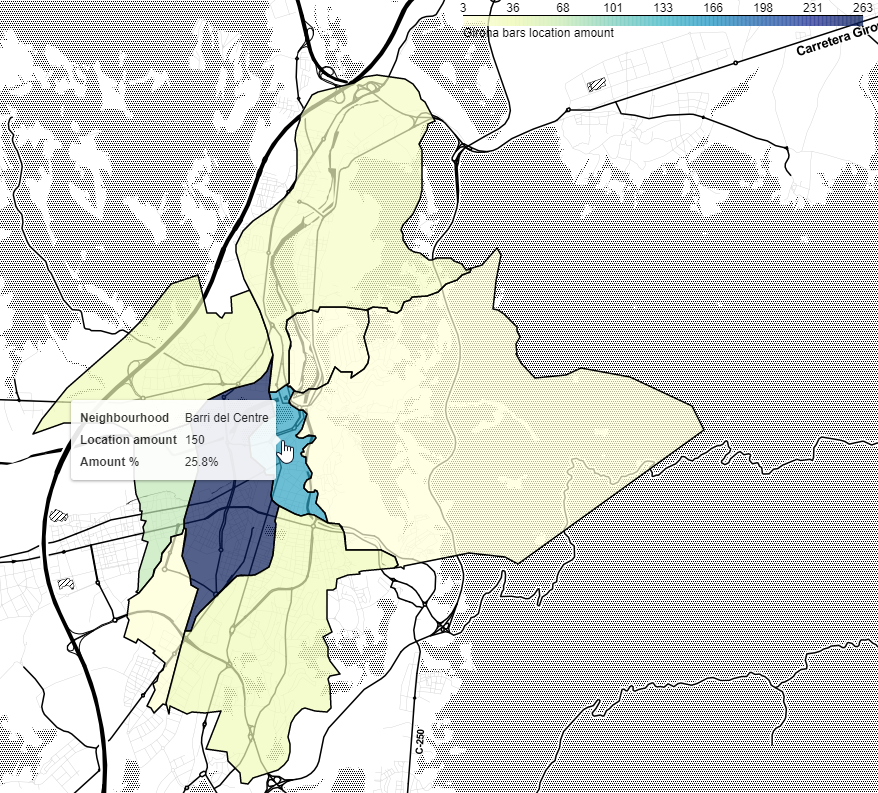
Now that we have our df ready with data lets put some style on the map. To do that we will be using the branca.colormap from linear, it is a utility module for dealing with colormaps. It will be used for the styling function to fill the colors to he map and create the scale on the top right.
Then we create the GeoJson object to be plotted to map with the amount of bars per nbh df, style function and the tooltip parameters that we want, in this case name, location amount and amount %, finally and we add it to map. And the result is:
References
- Zheng, J. (2019, November 08). jingwen-z.github.io. Retrieved from jingwen-z.github.io: How to draw a variety of maps with folium in python?
- Girona.cat. 2022. Establiments dedicats a activitats econòmiques - Activitats2020.csv - Girona Open Data. [online] Available at: Girona Open Data - activities
- Girona.cat. 2022. Barris - Barris.zip - Girona Open Data. [online] Available at: Girona Open Data - neighbourhoods