
Beer mapping with python (Part 1)
Recently, talking with friends and beer in hand, raise the topic about pint or “canya” price in relation to bar locations in our hometown Girona. So I decided to start a little research on this topic using python and related libraries to mapping and data visualization. So in this first post regarding beer mapping, we will walk through an interesting python library called Folium and another one called Geopandas.
Folium allows us to create interactive maps using leaflet.js, and makes it easier to bind manipulated data with Python and visualizations as markers on the map. In the other hand GeoPandas is a library to work with python data and combine the capabilites of pandas and shapely, providing geospatial operations in pandas and a high-level interface to multiple geometries to shapely.
Datasets
Before start to draw maps, I will explain the used datasets. The URLs to repositories are specified in references part. So, to get all the bars I previously filtered all active economic activities in Girona from the list of activities and the outcome is the file “activitats2020_bars.csv”, it contains all activities which match “bar” substring as activity name.
Activities file (.csv) –> link to download file
Display bar locations with points
Here is the main component, lets breakdown it step by step.
import folium
import geopandas as gpd
import helpers

input_activities = "./raw_data/activitats/activitats2020_bars.csv"
center = [41.97969558739158, 2.8213967358161915]

act_df = gpd.read_file(input_activities)

# Insert and Transform coordinates projection
bars_df = helpers.coordinates_to_point_activities(act_df)

# Insert random prices to bars
bars_df_with_price = helpers.add_random_price_to_df(act_df)

# Create a map
map_girona = folium.Map(location=center, zoom_start=13, tiles='Stamen Toner')

# Insert points to map
helpers.add_points_to_map(map_girona, bars_df_with_price)

# Insert colored points to map
# helpers.add_colored_points_to_map(map_girona, bars_df_with_price)

# Insert clusters to map
# helpers.add_clusters_to_map(map_girona, bars_df_with_price)

map_girona.save('index.html')
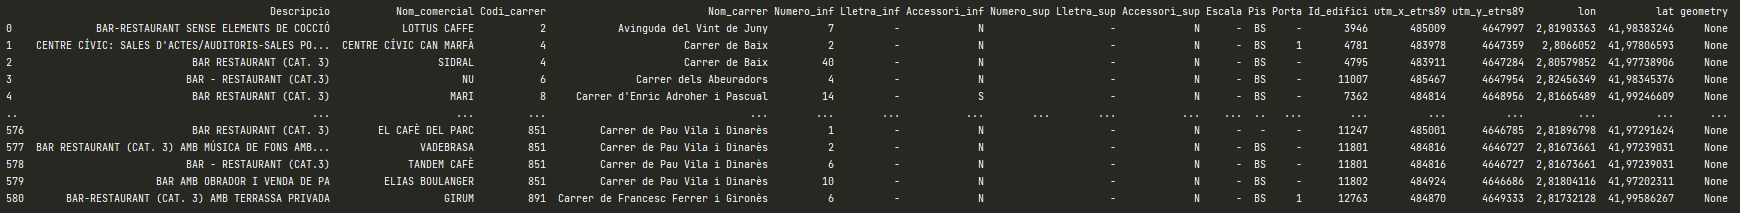
In order to have the points geometry data structure in our bars dataframe, the coordinates_to_point_activities method is created to convert the input string coordinates (lat, lon) from activities dataframe into floats. Then group as geometry Point objects, and insert them in geometry column into activities dataframe.
The important aspects in this methods are the crs (coordinate reference system) and GeoDataFrame method. The first is a common projection of WGS84 Latitude/Longitude which is a standard for use in cartography, geodesy, and satellite navigation. The second is a method from geopandas library that allows us to return an object with geometry column. In this case input parameters are the activities dataframe, the crs we are working with and we want the geometry object to have (4236) and geometry df bars_points_geometry, which is an array of Point objects.
def coordinates_to_point_activities(act_df):
    latitutdes = []
    longitudes = []

    for _,bar in act_df.iterrows():
        lat = bar['lat'].replace(',','.')
        lon = bar['lon'].replace(',', '.')
        latitutdes.append(float(lat))
        longitudes.append(float(lon))

    df = pd.DataFrame({
        'latitude': latitutdes,
        'longitude': longitudes
    })

    bars_points_geometry = [Point(xy) for xy in zip(df.longitude, df.latitude)]
    crs = {'init': 'epsg:4236'}
    bars_df_with_geometry = gpd.GeoDataFrame(act_df, crs=crs, geometry=bars_points_geometry)

    return bars_df_with_geometry
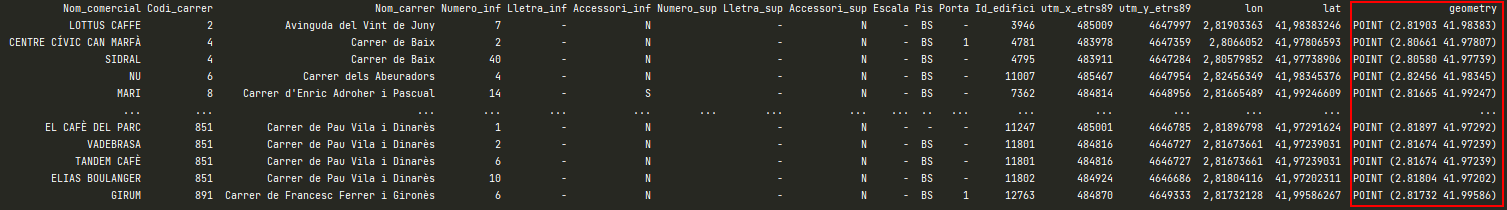
So, here we have the output bars_df_with_geometry containing geometry column with all Point objects.
Then to make the exercise more real we are creating random prices between a range and inseting them into the bars_df.
def add_random_price_to_df(bars_df):
    price_column = pd.Series([])

    for index,bar in bars_df.iterrows():
        price_column[index] = round(random.uniform(1.50, 3.00), 2)

    bars_df.insert(2, "Price", price_column)

    return bars_df
Next is the map object creation with folium.map, as you might have seen the input parameters we are using are center, zoom_start and tiles.
- center: center coordinates where the map will be focused
- zoom_start: initial zoom level that the map will start
- tiles: styiling that we will use for our map, in this case Stamen Toner
map_girona = folium.Map(location=center, zoom_start=13, tiles='Stamen Toner')
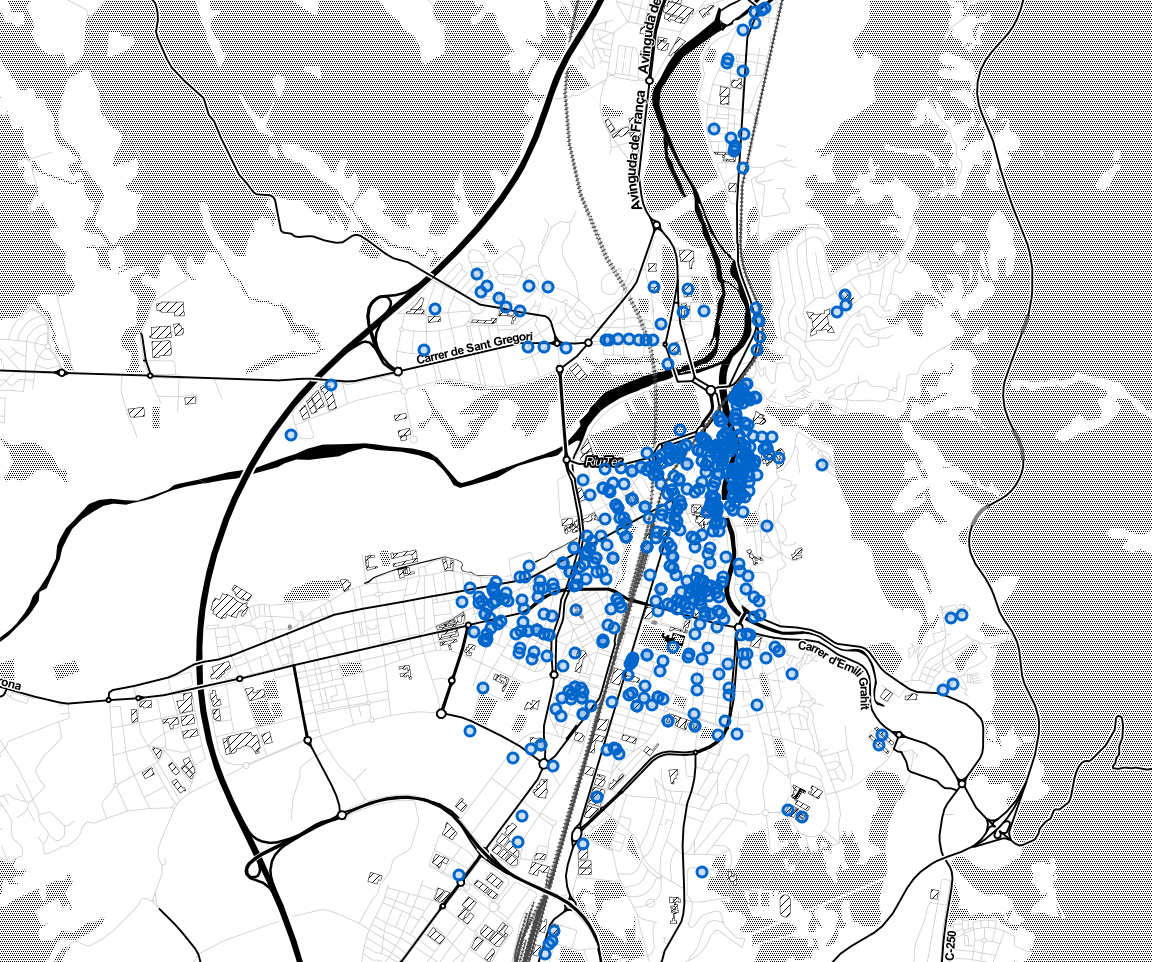
And now points can be drawn into map with method add_points_to_map. It creates a circle marker with location and tooltip for each bar. As seen below there is also FeatureGroup method from folium which creates a filter by types of circle markers, in nexts steps in this post will be shown.
def add_points_to_map(map, bars_df):
    feature_na = folium.FeatureGroup(name='n/a')

    for _, bar in bars_df.iterrows():
        popup = """
        Name : <b>%s</b><br>
        Description : <b>%s</b><br>
        Price : <b>%s</b><br>
        """ % (bar['Nom_comercial'], bar['Descripcio'], bar['Price'])

        location = tuple([bar['geometry'].y, bar['geometry'].x])
        radius = 3

        folium.CircleMarker(
            location=location,
            radius=radius,
            tooltip=popup,
            color='#0066CC',
            fill_color='#0066CC',
            fill=True).add_to(feature_na)

    feature_na.add_to(map)
    folium.LayerControl(collapsed=False).add_to(map)
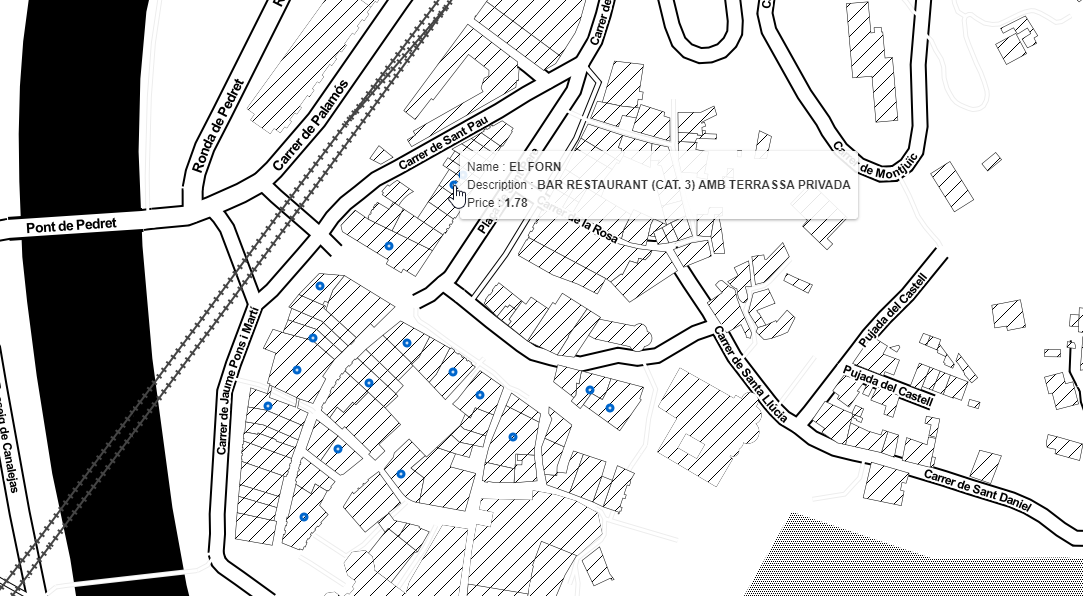
In this second picture the tooltip with bar info is shown
Display bar locations colored by beer price
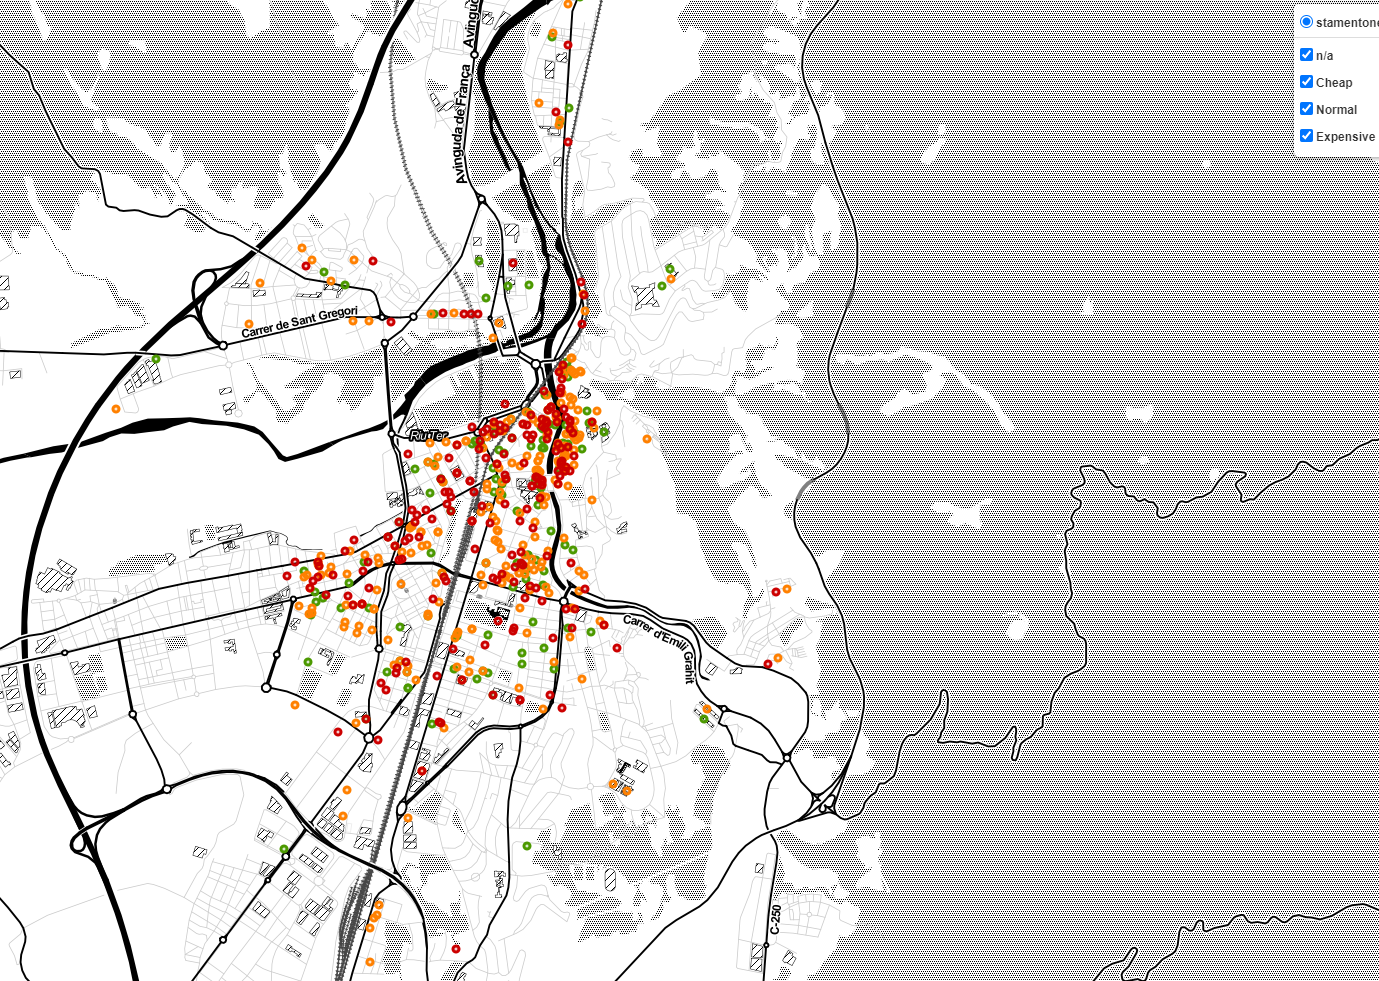
To make the map more pretty and alive, we have added some colors to points regarding the beer price of the bar. With method add_colored_points_to_map, we create 4 diferent feature groups that will vary according to the beer price.
def add_colored_points_to_map(map, bars_df):
    feature_na = folium.FeatureGroup(name='n/a')
    feature_cheap = folium.FeatureGroup(name='Cheap')
    feature_normal = folium.FeatureGroup(name='Normal')
    feature_expensive = folium.FeatureGroup(name='Expensive')

    for _, bar in bars_df.iterrows():
        popup = """
        Name : <b>%s</b><br>
        Description : <b>%s</b><br>
        Price : <b>%s</b><br>
        """ % (bar['Nom_comercial'], bar['Descripcio'], bar['Price'])

        location = tuple([bar['geometry'].y, bar['geometry'].x])
        radius = 3

        if bar['Price'] <= 1.80 and bar['Price'] > 0.00:
            folium.CircleMarker(
                location=location,
                radius=radius,
                tooltip=popup,
                color='#4C9900',
                fill_color='#4C9900',
                fill=True).add_to(feature_cheap)
        elif bar['Price'] >= 2.50:
            folium.CircleMarker(
                location=location,
                radius=radius,
                tooltip=popup,
                color='#CC0000',
                fill_color='#CC0000',
                fill=True).add_to(feature_expensive)
        elif bar['Price'] == 0.00:
            folium.CircleMarker(
                location=location,
                radius=radius,
                tooltip=popup,
                color='#0066CC',
                fill_color='#0066CC',
                fill=True).add_to(feature_na)
        else:
            folium.CircleMarker(
                location=location,
                radius=radius,
                tooltip=popup,
                color='#FF8000',
                fill_color='#FF8000',
                fill=True).add_to(feature_normal)

    feature_na.add_to(map)
    feature_cheap.add_to(map)
    feature_normal.add_to(map)
    feature_expensive.add_to(map)

    folium.LayerControl(collapsed=False).add_to(map)
Display bar locations with clusters
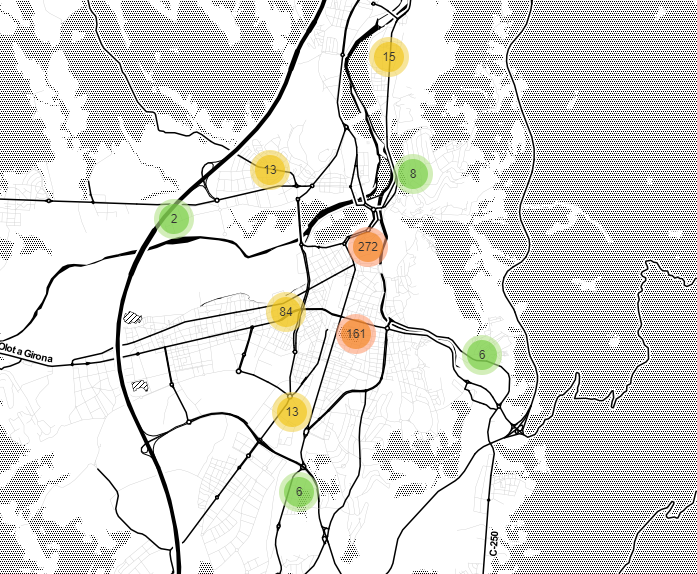
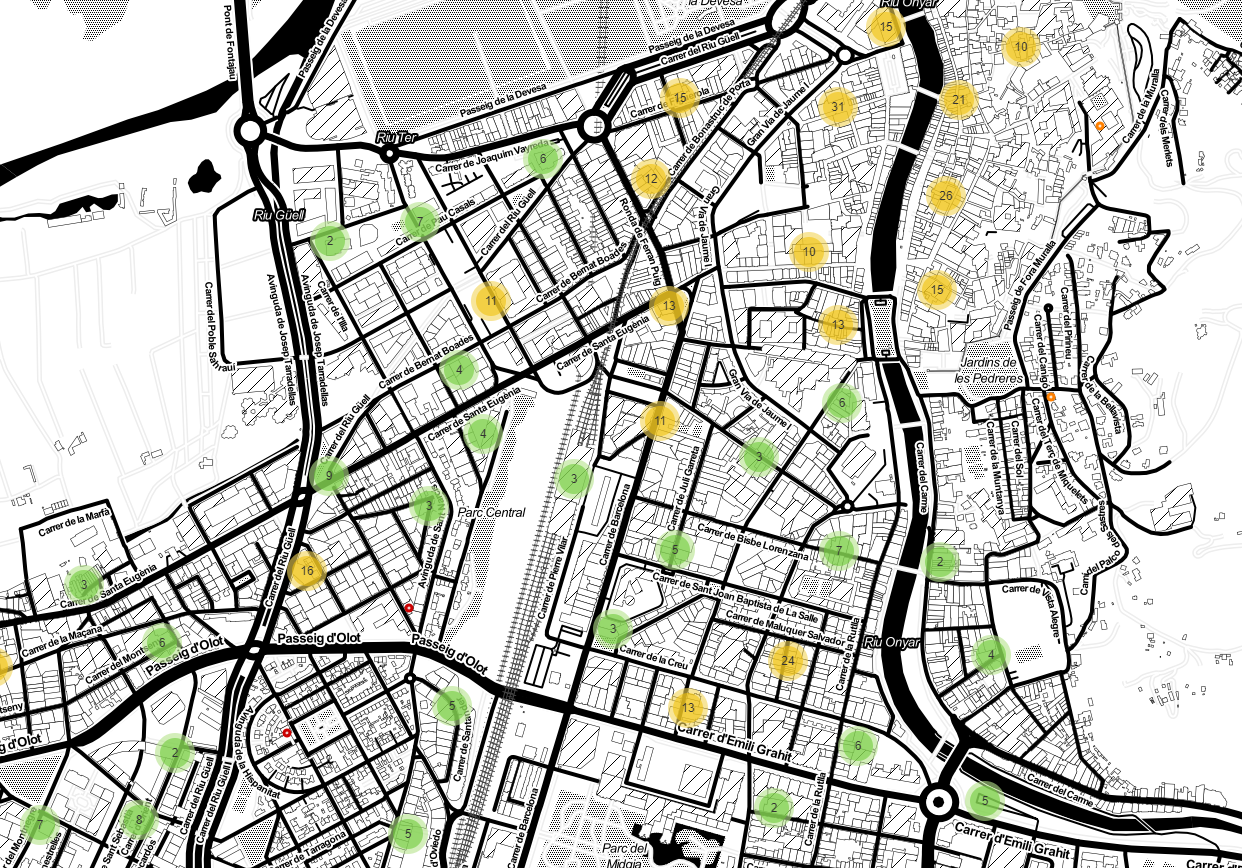
And last but not least, the points will be clustered depending on the zoom level of the map. The only diference with the previous methods is that MarkerCluster method is used. It is a pluguin that provides beautiful and animated Marker Clustering functionality for map. The only handicap using this clustering method is that filtering by grup is not enabled.
def add_clusters_to_map(map, bars_df):

    marker_cluster = folium.plugins.MarkerCluster().add_to(map)

    for _, bar in bars_df.iterrows():
        popup = """
        Name : <b>%s</b><br>
        Description : <b>%s</b><br>
        Price : <b>%s</b><br>
        """ % (bar['Nom_comercial'], bar['Descripcio'], bar['Price'])

        location = tuple([bar['geometry'].y, bar['geometry'].x])
        radius = 3

        if bar['Price'] <= 1.80 and bar['Price'] > 0.00:
            folium.CircleMarker(
                location=location,
                radius=radius,
                tooltip=popup,
                color='#4C9900',
                fill_color='#4C9900',
                fill=True).add_to(marker_cluster)
        elif bar['Price'] >= 2.50:
            folium.CircleMarker(
                location=location,
                radius=radius,
                tooltip=popup,
                color='#CC0000',
                fill_color='#CC0000',
                fill=True).add_to(marker_cluster)
        elif bar['Price'] == 0.00:
            folium.CircleMarker(
                location=location,
                radius=radius,
                tooltip=popup,
                color='#0066CC',
                fill_color='#0066CC',
                fill=True).add_to(marker_cluster)
        else:
            folium.CircleMarker(
                location=location,
                radius=radius,
                tooltip=popup,
                color='#FF8000',
                fill_color='#FF8000',
                fill=True).add_to(marker_cluster)

    folium.LayerControl(collapsed=False).add_to(map)
References
- Zheng, J. (2019, November 08). jingwen-z.github.io. Retrieved from jingwen-z.github.io: How to draw a variety of maps with folium in python?
- Girona.cat. 2022. Establiments dedicats a activitats econòmiques - Activitats2020.csv - Girona Open Data. [online] Available at: Girona Open Data - activities